What if the most important boundary in Antarctica is one you cannot see? A new NASA-supported study suggests that ocean water slipping under a major glacier could change how scientists estimate future sea-level rise. Here is what the evidence says—and what it does not.
The glacier that connects Antarctica to your coastline
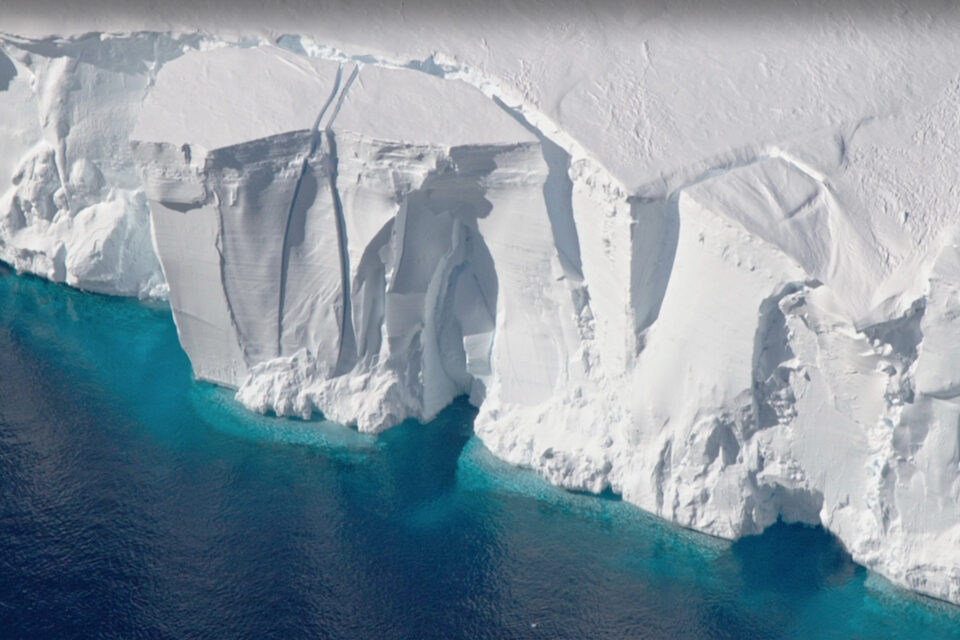
Thousands of kilometres from crowded coastal cities, the Thwaites Glacier flows towards the Amundsen Sea in West Antarctica. Its ice moves over land before reaching the ocean, where part of it becomes a floating ice shelf. A change in that remote system can eventually affect sea levels around the planet. That is why scientists study Thwaites not simply as a dramatic Antarctic landscape, but as a critical component of Earth’s climate system. The nickname “Doomsday Glacier” attracts attention, but it can mislead readers into imagining a single sudden catastrophe. The real concern is sustained ice loss, complex feedbacks and rising coastal risk over decades and centuries.
What NASA announced in October 2026
On 20 October 2026, NASA’s Jet Propulsion Laboratory described a new computer-modelling study conducted with researchers at the University of California, Irvine, and Dartmouth College. Published in Nature Communications on 12 October, the study tested how seawater moving beneath the edge of grounded ice changes the glacier’s future. Some simulations indicated a contribution to global mean sea level of about 30 millimetres by 2100, around twice a benchmark from earlier modelling. The finding does not mean all Antarctic ice will melt this century, nor does it describe the total sea-level rise from every global source.
The hidden boundary beneath the ice
A glacier is grounded where its weight rests on bedrock. Farther seaward, the ice begins to float. The transition is often represented in computer models as a thin grounding line. In reality, tides can force seawater kilometres beneath ice that is otherwise in contact with the ground. The resulting grounding zone repeatedly opens and closes as tides lift the ice. Warmer ocean water can reach surfaces previously treated as protected. This matters because a small difference in the physics of the boundary can create a large difference in the simulated rate of retreat.
Why a few kilometres can change the forecast
The researchers found that modelling grounding zones several kilometres wide helped reproduce the observed retreat, thinning and acceleration of Thwaites across nearly three decades. NASA reported that this approach matched historical satellite observations four times more closely than models without the process. This is an important methodological lesson: a forecast is only as credible as its representation of the mechanisms driving change. A better match to past observations is valuable, but it does not eliminate uncertainty about future ocean temperatures, ice dynamics or emissions.
The numbers explained without sensationalism
The research described model results reaching approximately 30 ± 6 millimetres of global mean sea-level rise by 2100 under certain assumptions. Thirty millimetres is three centimetres. It may sound small in isolation, but it is one contribution among many, including other glaciers, other Antarctic sectors, Greenland and thermal expansion of warming seawater. Coastal flooding risk also depends on local subsidence, tides, storm surges and infrastructure. A global average must not be interpreted as a uniform change at every beach or port.
Why Thwaites is vulnerable
Warm ocean water can melt floating ice from below. As the floating portion thins, it may provide less resistance to the flow of grounded ice behind it. Retreat across particular seabed shapes can also make continued ice loss more difficult to stop. The new study examined the possibility of ice losing contact with stabilising seabed ridges. In some simulations, that separation could occur as early as 2038, but this is a scenario outcome rather than an established date of future collapse.
How scientists watch a glacier from space
Researchers combine satellite radar, measurements of ice-surface height, maps of ice motion, ocean observations and computer simulations. Radar is particularly valuable for tracking movement and grounding-zone changes over broad, remote areas. Repeated measurements reveal how ice responds over time. The strongest research programmes compare models against observations, disclose their assumptions and update projections as new data arrive. Satellite evidence cannot directly answer every question about the ocean beneath the ice, which is why fieldwork and ocean instruments remain essential.
What rising seas could mean for India
India has extensive low-lying coastal settlements, ports, fisheries, transport corridors and ecosystems. Sea-level rise can make storm surges more damaging, increase saline intrusion into groundwater and worsen drainage in some places. The Sundarbans and other delta regions face particular challenges because coastal elevation, sediment movement and land subsidence interact with changing sea levels. However, the NASA study did not forecast flooding for Kolkata, Mumbai, Chennai or any individual Indian city. Such claims require local projections and risk assessments.
The difference between sea-level rise and a storm surge
Sea-level rise changes the baseline upon which tides and storms operate. A storm surge is a temporary increase in water level driven largely by meteorological conditions. When the baseline is higher, an otherwise similar storm can push water farther inland. This distinction is central to coastal planning: the glacier does not cause an individual cyclone, but long-term sea-level rise can amplify the damage caused by some coastal events.
Can the worst outcomes still be avoided?
Climate action and adaptation address different parts of the problem. Cutting greenhouse-gas emissions helps limit future warming and reduces long-term pressure on ice sheets. Adaptation includes improved flood maps, resilient drainage, coastal ecosystem protection, better building standards and carefully planned relocation where necessary. Neither action offers a simple switch that immediately restores lost ice. The timing and scale of responses should follow evidence and local circumstances rather than apocalyptic headlines.
What the study does not prove
The research does not establish a precise date when Thwaites will disappear. It does not claim that the world’s oceans will rise three centimetres tomorrow, nor that three centimetres represents the total rise expected by 2100. It investigates one glacier using a particular modelling framework and assumptions. Future work will test how results change with ocean conditions, glacier geometry and independent model approaches. Distinguishing measured changes from projected outcomes is essential to responsible science journalism.
Why this discovery matters beyond Antarctica
The wider lesson is that seemingly technical modelling details can reshape our understanding of global risk. Grounding zones are not an obscure footnote when they influence the stability of a major glacier. For students, this story connects physical geography, climate science, satellite technology, computational modelling, public policy and disaster preparedness. For everyone living near a coast, it is a reminder that the distant cryosphere is linked to local choices about infrastructure, housing and long-term resilience.
Frequently asked questions
Where is Thwaites Glacier?
It is in West Antarctica, flowing toward the Amundsen Sea.
Why is it called the Doomsday Glacier?
The nickname reflects concern about its potential long-term effect on sea levels; it is not a scientific prediction of sudden collapse.
Did NASA predict three centimetres of sea-level rise tomorrow?
No. The figure refers to a possible cumulative contribution by 2100 in certain model simulations.
Does melting floating ice raise sea level?
Floating ice has little direct effect when it melts, but loss of floating ice can allow grounded land ice to flow into the sea faster.
Does the study predict flooding in India?
No. Local flood risks require separate assessments of tides, storms, land subsidence and coastal infrastructure.
Read the original research
For a fuller understanding, consult NASA’s announcement and the peer-reviewed study rather than relying on alarming headlines.
Explore the Nature Communications Study
Editorial note: This feature explains published research as of 21 October 2026. Model scenarios are not guarantees. The article is for educational purposes.
 Oxford Student Atlas India Competitive