
What Happened
1. Why in News?
On 15 October 2026, the Ministry of Commerce and Industry released India's provisional foreign trade statistics for September 2026 and the first six months of financial year 2026–27. The report showed that India's combined merchandise and services exports during April–September 2026–27 were estimated at US$476.20 billion, compared with US$418.31 billion during the corresponding period of 2025–26. This represented estimated growth of 13.84%.
2. Official Source
The figures were released through the Press Information Bureau by the Ministry of Commerce and Industry. The release provides separate information about merchandise trade, services trade, imports, trade balances and the performance of important export sectors.
3. Reporting Period
The cumulative figures cover April to September 2026, the first six months of financial year 2026–27. A financial year in India generally runs from 1 April to 31 March of the following calendar year.
4. Total Exports
India's combined merchandise and services exports reached an estimated US$476.20 billion during April–September 2026–27. The comparable figure for April–September 2025–26 was US$418.31 billion.
5. Export Growth
The estimated year-on-year increase in total exports was 13.84%. Year-on-year growth compares a period with the corresponding period in the previous year, helping reduce distortions caused by seasonal differences.
6. Merchandise Exports
Merchandise exports during April–September 2026–27 were US$259.89 billion, compared with US$219.30 billion a year earlier. This represented growth of 18.51%. Merchandise exports refer to physical goods sold to buyers in other countries.
7. Services Exports
Services exports during April–September 2026–27 were estimated at US$216.31 billion, compared with US$199.02 billion during the corresponding period of the previous financial year. Services exports include activities such as information technology, business services and other services supplied to overseas customers.
8. Total Imports
India's combined merchandise and services imports during April–September 2026–27 were estimated at US$551.13 billion, compared with US$476.42 billion a year earlier. The government reported estimated import growth of 15.68%.
9. Overall Trade Balance
The combined merchandise and services trade balance during April–September 2026–27 was estimated at a deficit of US$74.93 billion, compared with a deficit of US$58.10 billion in the corresponding previous period. The wider deficit indicates that total imports exceeded total exports by a larger amount.
10. Merchandise Imports
Merchandise imports during April–September 2026–27 were US$437.53 billion, compared with US$376.17 billion during April–September 2025–26.
11. Merchandise Trade Deficit
The merchandise trade deficit during April–September 2026–27 was US$177.64 billion, compared with US$156.88 billion in the previous corresponding period. A merchandise trade deficit occurs when the value of imported goods exceeds the value of exported goods.
12. Services Trade Surplus
The estimated services trade surplus during April–September 2026–27 was US$102.71 billion, calculated as services exports of US$216.31 billion minus services imports of US$113.60 billion. This surplus partly offset the merchandise trade deficit.
13. September 2026 Total Exports
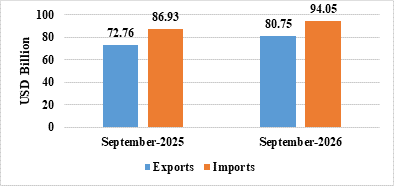
India's combined merchandise and services exports in September 2026 were estimated at US$80.75 billion, compared with US$72.76 billion in September 2025. The estimated growth rate was 10.99%.
14. September 2026 Total Imports
Combined merchandise and services imports in September 2026 were estimated at US$94.05 billion, compared with US$86.93 billion in September 2025. The estimated growth rate was 8.19%.
15. September Overall Trade Deficit
India's combined merchandise and services trade deficit for September 2026 was estimated at US$13.30 billion, compared with US$14.17 billion in September 2025. The monthly combined deficit was therefore smaller than a year earlier, even though the cumulative six-month deficit widened.
16. September Merchandise Exports
Merchandise exports in September 2026 stood at US$44.40 billion, compared with US$36.08 billion in September 2025. The increase demonstrates the importance of goods exports in the month's trade performance.
17. September Merchandise Imports
Merchandise imports in September 2026 were US$74.61 billion, compared with US$69.08 billion in September 2025. The resulting September merchandise trade deficit was US$30.21 billion.
18. September Services Trade
Services exports in September 2026 were estimated at US$36.35 billion, while services imports were estimated at US$19.44 billion. The implied monthly services trade surplus was US$16.91 billion.
19. Electronic Goods Exports
Electronic goods were a major contributor to merchandise export growth. Exports increased by 70.44%, from US$3.11 billion in September 2025 to US$5.31 billion in September 2026. This was among the strongest reported growth rates across the listed major product categories.
20. Importance of Electronics
Electronics exports are relevant to India's manufacturing and technology ambitions. The category may include a variety of electronic products, and its growth indicates increased overseas sales. However, the release does not establish that every electronics subcategory grew at the same rate.
21. Petroleum Products
Petroleum products exports increased by 31.90%, from US$4.71 billion in September 2025 to US$6.22 billion in September 2026. Petroleum product exports should be distinguished from crude oil production and crude oil imports.
22. Organic and Inorganic Chemicals
Exports of organic and inorganic chemicals increased by 24.21%, from US$2.37 billion in September 2025 to US$2.94 billion in September 2026. The chemical sector is important for manufacturing and international industrial supply chains.
23. Engineering Goods
Engineering goods exports increased by 20.91%, from US$10.06 billion in September 2025 to US$12.17 billion in September 2026. Engineering goods are an important category of manufactured exports.
24. Textiles and Handloom Products
Exports of cotton yarn, fabrics, made-ups and handloom products increased by 20.76%, from US$0.93 billion in September 2025 to US$1.12 billion in September 2026. This highlights the role of textile-related products in India's merchandise export basket.
25. Non-Petroleum Exports
Cumulative non-petroleum merchandise exports during April–September 2026–27 were valued at US$218.70 billion, compared with US$189.26 billion during the previous corresponding period. The government reported growth of 15.56%.
26. Exports Excluding Petroleum and Gems and Jewellery
Non-petroleum and non-gems-and-jewellery exports in September 2026 were US$34.81 billion, compared with US$28.53 billion in September 2025. This measure helps examine trade performance without some large and potentially volatile product groups.
27. Corresponding Imports
Non-petroleum and non-gems-and-jewellery imports in September 2026 were US$51.64 billion, compared with US$42.33 billion in September 2025.
28. Merchandise Versus Services
Merchandise trade involves physical products crossing national borders. Services trade involves economic activities such as software services, professional services, travel-related services and other internationally supplied services. Both are included in India's combined trade estimates.
29. Trade Deficit Versus Trade Surplus
A trade deficit occurs when imports exceed exports. A trade surplus occurs when exports exceed imports. India recorded a merchandise trade deficit but an estimated services trade surplus during the reporting period.
30. Why Services Matter
A services surplus can offset part of a merchandise deficit. In April–September 2026–27, India's estimated services surplus of US$102.71 billion reduced the effect of the US$177.64 billion merchandise deficit on the combined trade balance.
31. Export Diversification
The performance of electronics, petroleum products, chemicals, engineering goods and textiles shows that export growth came from several major product categories. Diversification can reduce dependence on a single export sector, although the degree of diversification requires further analysis.
32. International Competitiveness
Export growth can reflect changes in overseas demand, production capacity, prices, exchange rates and competitiveness. The reported statistics establish export performance but do not by themselves prove which factor caused the increase.
33. Exchange Rate Consideration
The official figures are expressed in US dollars. Changes in exchange rates can influence the dollar value of international trade. Students should distinguish changes in trade value from changes in the physical quantity of goods exported.
34. Provisional and Estimated Figures
The report describes some figures as provisional or estimated. In particular, September 2026 services figures were estimated because the latest RBI services data available at the time related to August 2026. These estimates may be revised later.
35. RBI's Role
The Reserve Bank of India provides important data relating to international trade in services and India's balance of payments. The Commerce Ministry uses available statistical information to compile its monthly trade release.
36. Balance of Payments
The balance of payments is a broader statistical record of transactions between residents of an economy and the rest of the world. The merchandise and services trade balance is related to, but not identical to, the complete current account balance or overall balance of payments.
37. Revisions to Earlier Data
The PIB release notes that data for April–September 2025–26 and April–June 2026–27 were revised on a pro-rata basis using quarterly balance-of-payments data. This illustrates why economic statistics can change after their initial publication.
38. Importance for Economic Policy
Trade statistics help policymakers understand external demand, import requirements, sectoral performance and potential pressure on external balances. They are relevant to export promotion, industrial policy and economic planning.
39. Importance for Competitive Examinations
The release is important for UPSC, SSC, Railway NTPC, banking examinations and State PCS. Students should focus on the reporting period, total exports, export growth, merchandise exports, services exports, trade deficits and major sectoral growth rates.
40. Overall Significance
India's exports recorded substantial estimated growth during the first half of financial year 2026–27, led by strong merchandise performance and notable growth in electronics and other sectors. However, imports also increased and the cumulative combined trade deficit widened. A balanced interpretation must consider both export growth and the external trade gap.
क्या हुआ?
1. चर्चा में क्यों?
15 अक्टूबर 2026 को वाणिज्य एवं उद्योग मंत्रालय ने सितंबर 2026 तथा वित्त वर्ष 2026–27 के पहले छह महीनों के लिए भारत के अनंतिम विदेश व्यापार आंकड़े जारी किए। रिपोर्ट के अनुसार अप्रैल–सितंबर 2026–27 में भारत का वस्तुओं और सेवाओं का संयुक्त निर्यात अनुमानतः 476.20 अरब अमेरिकी डॉलर रहा, जबकि वित्त वर्ष 2025–26 की समान अवधि में यह 418.31 अरब अमेरिकी डॉलर था। इस प्रकार अनुमानित वृद्धि 13.84 प्रतिशत रही।
2. आधिकारिक स्रोत
ये आंकड़े वाणिज्य एवं उद्योग मंत्रालय ने प्रेस सूचना ब्यूरो के माध्यम से जारी किए। विज्ञप्ति में वस्तु व्यापार, सेवा व्यापार, आयात, व्यापार संतुलन और महत्वपूर्ण निर्यात क्षेत्रों के प्रदर्शन की अलग-अलग जानकारी दी गई है।
3. रिपोर्ट की अवधि
संचयी आंकड़े अप्रैल से सितंबर 2026 तक के हैं, जो वित्त वर्ष 2026–27 के पहले छह महीने हैं। भारत में वित्त वर्ष सामान्यतः 1 अप्रैल से अगले कैलेंडर वर्ष की 31 मार्च तक चलता है।
4. कुल निर्यात
अप्रैल–सितंबर 2026–27 में भारत का वस्तुओं और सेवाओं का संयुक्त निर्यात अनुमानतः 476.20 अरब अमेरिकी डॉलर रहा। अप्रैल–सितंबर 2025–26 में संबंधित आंकड़ा 418.31 अरब अमेरिकी डॉलर था।
5. निर्यात वृद्धि
कुल निर्यात में वर्ष-दर-वर्ष अनुमानित वृद्धि 13.84 प्रतिशत रही। वर्ष-दर-वर्ष वृद्धि में किसी अवधि की तुलना पिछले वर्ष की उसी अवधि से की जाती है, जिससे मौसमी अंतर का प्रभाव कम करने में सहायता मिलती है।
6. वस्तु निर्यात
अप्रैल–सितंबर 2026–27 में वस्तु निर्यात 259.89 अरब अमेरिकी डॉलर रहा, जबकि एक वर्ष पहले यह 219.30 अरब अमेरिकी डॉलर था। इस प्रकार वृद्धि 18.51 प्रतिशत रही। वस्तु निर्यात का अर्थ दूसरे देशों के खरीदारों को बेचे गए भौतिक उत्पादों से है।
7. सेवा निर्यात
अप्रैल–सितंबर 2026–27 में सेवा निर्यात अनुमानतः 216.31 अरब अमेरिकी डॉलर रहा, जबकि पिछले वित्त वर्ष की समान अवधि में यह 199.02 अरब अमेरिकी डॉलर था। सेवा निर्यात में सूचना प्रौद्योगिकी, व्यावसायिक सेवाओं और विदेशी ग्राहकों को प्रदान की जाने वाली अन्य सेवाओं जैसी गतिविधियां शामिल होती हैं।
8. कुल आयात
अप्रैल–सितंबर 2026–27 में भारत का वस्तुओं और सेवाओं का संयुक्त आयात अनुमानतः 551.13 अरब अमेरिकी डॉलर रहा, जबकि एक वर्ष पहले यह 476.42 अरब अमेरिकी डॉलर था। सरकार ने आयात में अनुमानित वृद्धि 15.68 प्रतिशत बताई।
9. समग्र व्यापार संतुलन
अप्रैल–सितंबर 2026–27 में वस्तुओं और सेवाओं का संयुक्त व्यापार घाटा अनुमानतः 74.93 अरब अमेरिकी डॉलर रहा, जबकि पिछले वर्ष की समान अवधि में घाटा 58.10 अरब अमेरिकी डॉलर था। घाटा बढ़ने का अर्थ है कि कुल आयात, कुल निर्यात से अधिक मात्रा में बढ़कर ऊपर रहा।
10. वस्तु आयात
अप्रैल–सितंबर 2026–27 में वस्तु आयात 437.53 अरब अमेरिकी डॉलर रहा, जबकि अप्रैल–सितंबर 2025–26 में यह 376.17 अरब अमेरिकी डॉलर था।
11. वस्तु व्यापार घाटा
अप्रैल–सितंबर 2026–27 में वस्तु व्यापार घाटा 177.64 अरब अमेरिकी डॉलर रहा, जबकि पिछले वर्ष की समान अवधि में यह 156.88 अरब अमेरिकी डॉलर था। वस्तु व्यापार घाटा तब होता है जब आयातित वस्तुओं का मूल्य निर्यातित वस्तुओं के मूल्य से अधिक होता है।
12. सेवा व्यापार अधिशेष
अप्रैल–सितंबर 2026–27 में अनुमानित सेवा व्यापार अधिशेष 102.71 अरब अमेरिकी डॉलर रहा। इसकी गणना 216.31 अरब अमेरिकी डॉलर के सेवा निर्यात में से 113.60 अरब अमेरिकी डॉलर के सेवा आयात को घटाकर की जाती है। इस अधिशेष ने वस्तु व्यापार घाटे की आंशिक भरपाई की।
13. सितंबर 2026 का कुल निर्यात
सितंबर 2026 में भारत का वस्तुओं और सेवाओं का संयुक्त निर्यात अनुमानतः 80.75 अरब अमेरिकी डॉलर रहा, जबकि सितंबर 2025 में यह 72.76 अरब अमेरिकी डॉलर था। अनुमानित वृद्धि दर 10.99 प्रतिशत रही।
14. सितंबर 2026 का कुल आयात
सितंबर 2026 में वस्तुओं और सेवाओं का संयुक्त आयात अनुमानतः 94.05 अरब अमेरिकी डॉलर रहा, जबकि सितंबर 2025 में यह 86.93 अरब अमेरिकी डॉलर था। अनुमानित वृद्धि दर 8.19 प्रतिशत रही।
15. सितंबर का समग्र व्यापार घाटा
सितंबर 2026 में भारत का वस्तुओं और सेवाओं का संयुक्त व्यापार घाटा अनुमानतः 13.30 अरब अमेरिकी डॉलर रहा, जबकि सितंबर 2025 में यह 14.17 अरब अमेरिकी डॉलर था। इस प्रकार मासिक संयुक्त घाटा एक वर्ष पहले की तुलना में कम रहा, हालांकि छह महीनों का संचयी घाटा बढ़ा।
16. सितंबर में वस्तु निर्यात
सितंबर 2026 में वस्तु निर्यात 44.40 अरब अमेरिकी डॉलर रहा, जबकि सितंबर 2025 में यह 36.08 अरब अमेरिकी डॉलर था। यह वृद्धि उस महीने के व्यापार प्रदर्शन में वस्तु निर्यात के महत्व को दर्शाती है।
17. सितंबर में वस्तु आयात
सितंबर 2026 में वस्तु आयात 74.61 अरब अमेरिकी डॉलर रहा, जबकि सितंबर 2025 में यह 69.08 अरब अमेरिकी डॉलर था। इस प्रकार सितंबर में वस्तु व्यापार घाटा 30.21 अरब अमेरिकी डॉलर रहा।
18. सितंबर में सेवा व्यापार
सितंबर 2026 में सेवा निर्यात अनुमानतः 36.35 अरब अमेरिकी डॉलर और सेवा आयात 19.44 अरब अमेरिकी डॉलर रहा। इससे मासिक सेवा व्यापार अधिशेष 16.91 अरब अमेरिकी डॉलर निकलता है।
19. इलेक्ट्रॉनिक वस्तुओं का निर्यात
इलेक्ट्रॉनिक वस्तुएं निर्यात वृद्धि का महत्वपूर्ण स्रोत रहीं। इनका निर्यात सितंबर 2025 के 3.11 अरब अमेरिकी डॉलर से 70.44 प्रतिशत बढ़कर सितंबर 2026 में 5.31 अरब अमेरिकी डॉलर हो गया। यह सूचीबद्ध प्रमुख उत्पाद श्रेणियों में सबसे ऊंची वृद्धि दरों में से एक थी।
20. इलेक्ट्रॉनिक्स का महत्व
इलेक्ट्रॉनिक्स निर्यात भारत की विनिर्माण और तकनीकी महत्वाकांक्षाओं से संबंधित है। इस श्रेणी में विभिन्न इलेक्ट्रॉनिक उत्पाद शामिल हो सकते हैं और इसकी वृद्धि विदेशों में बढ़ती बिक्री दर्शाती है। हालांकि विज्ञप्ति यह स्थापित नहीं करती कि इलेक्ट्रॉनिक्स की प्रत्येक उपश्रेणी समान दर से बढ़ी।
21. पेट्रोलियम उत्पाद
पेट्रोलियम उत्पादों का निर्यात सितंबर 2025 के 4.71 अरब अमेरिकी डॉलर से 31.90 प्रतिशत बढ़कर सितंबर 2026 में 6.22 अरब अमेरिकी डॉलर हो गया। पेट्रोलियम उत्पादों के निर्यात को कच्चे तेल के उत्पादन और कच्चे तेल के आयात से अलग समझना चाहिए।
22. कार्बनिक और अकार्बनिक रसायन
कार्बनिक और अकार्बनिक रसायनों का निर्यात सितंबर 2025 के 2.37 अरब अमेरिकी डॉलर से 24.21 प्रतिशत बढ़कर सितंबर 2026 में 2.94 अरब अमेरिकी डॉलर हो गया। रसायन क्षेत्र विनिर्माण और अंतरराष्ट्रीय औद्योगिक आपूर्ति शृंखलाओं के लिए महत्वपूर्ण है।
23. इंजीनियरिंग वस्तुएं
इंजीनियरिंग वस्तुओं का निर्यात सितंबर 2025 के 10.06 अरब अमेरिकी डॉलर से 20.91 प्रतिशत बढ़कर सितंबर 2026 में 12.17 अरब अमेरिकी डॉलर हो गया। इंजीनियरिंग वस्तुएं विनिर्मित निर्यात की महत्वपूर्ण श्रेणी हैं।
24. वस्त्र और हथकरघा उत्पाद
सूती धागे, कपड़ों, तैयार वस्त्र उत्पादों और हथकरघा उत्पादों का निर्यात सितंबर 2025 के 0.93 अरब अमेरिकी डॉलर से 20.76 प्रतिशत बढ़कर सितंबर 2026 में 1.12 अरब अमेरिकी डॉलर हो गया। यह भारत के निर्यात में वस्त्र संबंधी उत्पादों की भूमिका दर्शाता है।
25. गैर-पेट्रोलियम निर्यात
अप्रैल–सितंबर 2026–27 में संचयी गैर-पेट्रोलियम वस्तु निर्यात 218.70 अरब अमेरिकी डॉलर रहा, जबकि पिछले वर्ष की समान अवधि में यह 189.26 अरब अमेरिकी डॉलर था। सरकार ने वृद्धि 15.56 प्रतिशत बताई।
26. पेट्रोलियम और रत्न-आभूषण को छोड़कर निर्यात
सितंबर 2026 में पेट्रोलियम तथा रत्न एवं आभूषण को छोड़कर निर्यात 34.81 अरब अमेरिकी डॉलर रहा, जबकि सितंबर 2025 में यह 28.53 अरब अमेरिकी डॉलर था। यह माप कुछ बड़े और संभावित रूप से अधिक उतार-चढ़ाव वाले उत्पाद समूहों को हटाकर व्यापार प्रदर्शन समझने में सहायता करता है।
27. संबंधित आयात
सितंबर 2026 में पेट्रोलियम तथा रत्न एवं आभूषण को छोड़कर आयात 51.64 अरब अमेरिकी डॉलर रहा, जबकि सितंबर 2025 में यह 42.33 अरब अमेरिकी डॉलर था।
28. वस्तु और सेवा व्यापार में अंतर
वस्तु व्यापार में देशों की सीमाओं के पार भौतिक उत्पादों का लेनदेन होता है। सेवा व्यापार में सॉफ्टवेयर सेवाएं, पेशेवर सेवाएं, यात्रा संबंधी सेवाएं और अंतरराष्ट्रीय स्तर पर प्रदान की जाने वाली अन्य आर्थिक गतिविधियां शामिल होती हैं। दोनों को भारत के संयुक्त व्यापार अनुमान में शामिल किया जाता है।
29. व्यापार घाटा और व्यापार अधिशेष
व्यापार घाटा तब होता है जब आयात का मूल्य निर्यात से अधिक होता है। व्यापार अधिशेष तब होता है जब निर्यात का मूल्य आयात से अधिक होता है। रिपोर्ट की अवधि में भारत का वस्तु व्यापार घाटे में था, लेकिन सेवा व्यापार में अनुमानित अधिशेष रहा।
30. सेवाओं का महत्व
सेवा व्यापार अधिशेष वस्तु व्यापार घाटे की आंशिक भरपाई कर सकता है। अप्रैल–सितंबर 2026–27 में भारत के अनुमानित 102.71 अरब अमेरिकी डॉलर के सेवा अधिशेष ने 177.64 अरब अमेरिकी डॉलर के वस्तु व्यापार घाटे का संयुक्त व्यापार संतुलन पर प्रभाव कम किया।
31. निर्यात विविधीकरण
इलेक्ट्रॉनिक्स, पेट्रोलियम उत्पादों, रसायनों, इंजीनियरिंग वस्तुओं और वस्त्रों का प्रदर्शन दर्शाता है कि निर्यात वृद्धि कई प्रमुख उत्पाद श्रेणियों से आई। विविधीकरण किसी एक निर्यात क्षेत्र पर निर्भरता घटा सकता है, हालांकि इसकी वास्तविक मात्रा समझने के लिए आगे विश्लेषण आवश्यक है।
32. अंतरराष्ट्रीय प्रतिस्पर्धात्मकता
निर्यात वृद्धि विदेशी मांग, उत्पादन क्षमता, कीमतों, विनिमय दरों और प्रतिस्पर्धात्मकता में बदलाव से प्रभावित हो सकती है। रिपोर्ट किए गए आंकड़े निर्यात प्रदर्शन की पुष्टि करते हैं, लेकिन अपने आप यह सिद्ध नहीं करते कि वृद्धि का कारण कौन-सा कारक था।
33. विनिमय दर का महत्व
आधिकारिक आंकड़े अमेरिकी डॉलर में दिए गए हैं। विनिमय दरों में बदलाव अंतरराष्ट्रीय व्यापार के डॉलर मूल्य को प्रभावित कर सकता है। विद्यार्थियों को व्यापार के मूल्य में बदलाव और निर्यातित वस्तुओं की भौतिक मात्रा में बदलाव के बीच अंतर समझना चाहिए।
34. अनंतिम और अनुमानित आंकड़े
रिपोर्ट में कुछ आंकड़ों को अनंतिम या अनुमानित बताया गया है। विशेष रूप से सितंबर 2026 के सेवा व्यापार आंकड़े अनुमानित थे क्योंकि उस समय उपलब्ध RBI के नवीनतम सेवा व्यापार आंकड़े अगस्त 2026 तक के थे। बाद में इन अनुमानों में संशोधन हो सकता है।
35. RBI की भूमिका
भारतीय रिजर्व बैंक अंतरराष्ट्रीय सेवा व्यापार और भारत के भुगतान संतुलन से संबंधित महत्वपूर्ण आंकड़े उपलब्ध कराता है। वाणिज्य मंत्रालय अपनी मासिक व्यापार विज्ञप्ति तैयार करने में उपलब्ध सांख्यिकीय जानकारी का उपयोग करता है।
36. भुगतान संतुलन
भुगतान संतुलन किसी अर्थव्यवस्था के निवासियों और शेष विश्व के बीच आर्थिक लेनदेन का व्यापक सांख्यिकीय विवरण है। वस्तुओं और सेवाओं का व्यापार संतुलन इससे संबंधित है, लेकिन यह संपूर्ण चालू खाता संतुलन या समग्र भुगतान संतुलन के समान नहीं है।
37. पुराने आंकड़ों में संशोधन
PIB विज्ञप्ति के अनुसार अप्रैल–सितंबर 2025–26 और अप्रैल–जून 2026–27 के आंकड़ों में तिमाही भुगतान संतुलन आंकड़ों का उपयोग करते हुए आनुपातिक आधार पर संशोधन किया गया। यह दर्शाता है कि प्रारंभिक प्रकाशन के बाद आर्थिक आंकड़े बदल सकते हैं।
38. आर्थिक नीति के लिए महत्व
व्यापार आंकड़े नीति निर्माताओं को विदेशी मांग, आयात आवश्यकताओं, विभिन्न क्षेत्रों के प्रदर्शन और बाह्य व्यापार संतुलन पर संभावित दबाव समझने में सहायता करते हैं। ये निर्यात प्रोत्साहन, औद्योगिक नीति और आर्थिक योजना के लिए प्रासंगिक हैं।
39. प्रतियोगी परीक्षाओं के लिए महत्व
यह विज्ञप्ति UPSC, SSC, रेलवे NTPC, बैंकिंग और राज्य लोक सेवा आयोग की परीक्षाओं के लिए महत्वपूर्ण है। विद्यार्थियों को रिपोर्ट की अवधि, कुल निर्यात, निर्यात वृद्धि, वस्तु निर्यात, सेवा निर्यात, व्यापार घाटे और प्रमुख क्षेत्रों की वृद्धि दरों पर विशेष ध्यान देना चाहिए।
40. समग्र महत्व
वित्त वर्ष 2026–27 की पहली छमाही में भारत के निर्यात में उल्लेखनीय अनुमानित वृद्धि दर्ज हुई। इसमें वस्तु निर्यात के मजबूत प्रदर्शन तथा इलेक्ट्रॉनिक्स और अन्य क्षेत्रों की वृद्धि की महत्वपूर्ण भूमिका रही। हालांकि आयात भी बढ़ा और संचयी संयुक्त व्यापार घाटा अधिक हो गया। संतुलित विश्लेषण के लिए निर्यात वृद्धि और बाह्य व्यापार घाटे दोनों पर विचार करना आवश्यक है।
Key Facts
• The foreign trade statistics were released on 15 October 2026.
• The releasing ministry was the Ministry of Commerce and Industry.
• The cumulative reporting period was April–September 2026–27.
• India's total exports were estimated at US$476.20 billion.
• Total exports in the previous corresponding period were US$418.31 billion.
• Estimated total export growth was 13.84%.
• Cumulative merchandise exports were US$259.89 billion.
• Previous-period merchandise exports were US$219.30 billion.
• Merchandise export growth was 18.51%.
• Cumulative services exports were estimated at US$216.31 billion.
• Previous-period services exports were US$199.02 billion.
• Total imports were estimated at US$551.13 billion.
• Total imports in the previous corresponding period were US$476.42 billion.
• Estimated total import growth was 15.68%.
• The combined trade deficit was estimated at US$74.93 billion.
• The previous corresponding combined deficit was US$58.10 billion.
• Cumulative merchandise imports were US$437.53 billion.
• Previous-period merchandise imports were US$376.17 billion.
• The merchandise trade deficit was US$177.64 billion.
• The previous corresponding merchandise deficit was US$156.88 billion.
• Cumulative services imports were estimated at US$113.60 billion.
• The estimated cumulative services trade surplus was US$102.71 billion.
• Total exports in September 2026 were estimated at US$80.75 billion.
• September total export growth was 10.99%.
• Total imports in September 2026 were estimated at US$94.05 billion.
• September total import growth was 8.19%.
• The September combined trade deficit was US$13.30 billion.
• The September 2025 combined trade deficit was US$14.17 billion.
• September 2026 merchandise exports were US$44.40 billion.
• September 2026 merchandise imports were US$74.61 billion.
• September 2026 services exports were estimated at US$36.35 billion.
• September 2026 services imports were estimated at US$19.44 billion.
• Electronic goods export growth in September 2026 was 70.44%.
• Electronic goods exports reached US$5.31 billion in September 2026.
• Petroleum products export growth was 31.90%.
• Petroleum products exports reached US$6.22 billion.
• Organic and inorganic chemicals export growth was 24.21%.
• Organic and inorganic chemicals exports reached US$2.94 billion.
• Engineering goods export growth was 20.91%.
• Engineering goods exports reached US$12.17 billion.
• Cotton yarn, fabrics, made-ups and handloom export growth was 20.76%.
• The textile-related category reached US$1.12 billion.
• Cumulative non-petroleum exports were US$218.70 billion.
• Cumulative non-petroleum export growth was 15.56%.
• September non-petroleum and non-gems-and-jewellery exports were US$34.81 billion.
• September non-petroleum and non-gems-and-jewellery imports were US$51.64 billion.
• The September 2026 services figures were estimates.
• The latest RBI services data available for the release related to August 2026.
• The PIB release identification number is 2323944.
मुख्य तथ्य
• विदेश व्यापार आंकड़े 15 अक्टूबर 2026 को जारी किए गए।
• आंकड़े जारी करने वाला मंत्रालय वाणिज्य एवं उद्योग मंत्रालय था।
• संचयी रिपोर्ट की अवधि अप्रैल–सितंबर 2026–27 थी।
• भारत का कुल निर्यात अनुमानतः 476.20 अरब अमेरिकी डॉलर था।
• पिछले वर्ष की समान अवधि में कुल निर्यात 418.31 अरब अमेरिकी डॉलर था।
• कुल निर्यात में अनुमानित वृद्धि 13.84 प्रतिशत थी।
• संचयी वस्तु निर्यात 259.89 अरब अमेरिकी डॉलर था।
• पिछली समान अवधि में वस्तु निर्यात 219.30 अरब अमेरिकी डॉलर था।
• वस्तु निर्यात में वृद्धि 18.51 प्रतिशत थी।
• संचयी सेवा निर्यात अनुमानतः 216.31 अरब अमेरिकी डॉलर था।
• पिछली समान अवधि में सेवा निर्यात 199.02 अरब अमेरिकी डॉलर था।
• कुल आयात अनुमानतः 551.13 अरब अमेरिकी डॉलर था।
• पिछली समान अवधि में कुल आयात 476.42 अरब अमेरिकी डॉलर था।
• कुल आयात में अनुमानित वृद्धि 15.68 प्रतिशत थी।
• संयुक्त व्यापार घाटा अनुमानतः 74.93 अरब अमेरिकी डॉलर था।
• पिछली समान अवधि में संयुक्त व्यापार घाटा 58.10 अरब अमेरिकी डॉलर था।
• संचयी वस्तु आयात 437.53 अरब अमेरिकी डॉलर था।
• पिछली समान अवधि में वस्तु आयात 376.17 अरब अमेरिकी डॉलर था।
• वस्तु व्यापार घाटा 177.64 अरब अमेरिकी डॉलर था।
• पिछली समान अवधि में वस्तु व्यापार घाटा 156.88 अरब अमेरिकी डॉलर था।
• संचयी सेवा आयात अनुमानतः 113.60 अरब अमेरिकी डॉलर था।
• संचयी सेवा व्यापार अधिशेष अनुमानतः 102.71 अरब अमेरिकी डॉलर था।
• सितंबर 2026 में कुल निर्यात अनुमानतः 80.75 अरब अमेरिकी डॉलर था।
• सितंबर में कुल निर्यात वृद्धि 10.99 प्रतिशत थी।
• सितंबर 2026 में कुल आयात अनुमानतः 94.05 अरब अमेरिकी डॉलर था।
• सितंबर में कुल आयात वृद्धि 8.19 प्रतिशत थी।
• सितंबर का संयुक्त व्यापार घाटा 13.30 अरब अमेरिकी डॉलर था।
• सितंबर 2025 का संयुक्त व्यापार घाटा 14.17 अरब अमेरिकी डॉलर था।
• सितंबर 2026 में वस्तु निर्यात 44.40 अरब अमेरिकी डॉलर था।
• सितंबर 2026 में वस्तु आयात 74.61 अरब अमेरिकी डॉलर था।
• सितंबर 2026 में सेवा निर्यात अनुमानतः 36.35 अरब अमेरिकी डॉलर था।
• सितंबर 2026 में सेवा आयात अनुमानतः 19.44 अरब अमेरिकी डॉलर था।
• सितंबर 2026 में इलेक्ट्रॉनिक वस्तुओं का निर्यात 70.44 प्रतिशत बढ़ा।
• सितंबर 2026 में इलेक्ट्रॉनिक वस्तुओं का निर्यात 5.31 अरब अमेरिकी डॉलर रहा।
• पेट्रोलियम उत्पादों का निर्यात 31.90 प्रतिशत बढ़ा।
• पेट्रोलियम उत्पादों का निर्यात 6.22 अरब अमेरिकी डॉलर रहा।
• कार्बनिक और अकार्बनिक रसायनों का निर्यात 24.21 प्रतिशत बढ़ा।
• कार्बनिक और अकार्बनिक रसायनों का निर्यात 2.94 अरब अमेरिकी डॉलर रहा।
• इंजीनियरिंग वस्तुओं का निर्यात 20.91 प्रतिशत बढ़ा।
• इंजीनियरिंग वस्तुओं का निर्यात 12.17 अरब अमेरिकी डॉलर रहा।
• सूती धागे, कपड़ों, तैयार उत्पादों और हथकरघा निर्यात में 20.76 प्रतिशत वृद्धि हुई।
• इस वस्त्र संबंधी श्रेणी का निर्यात 1.12 अरब अमेरिकी डॉलर रहा।
• संचयी गैर-पेट्रोलियम निर्यात 218.70 अरब अमेरिकी डॉलर रहा।
• संचयी गैर-पेट्रोलियम निर्यात वृद्धि 15.56 प्रतिशत थी।
• सितंबर में पेट्रोलियम तथा रत्न-आभूषण को छोड़कर निर्यात 34.81 अरब अमेरिकी डॉलर था।
• सितंबर में पेट्रोलियम तथा रत्न-आभूषण को छोड़कर आयात 51.64 अरब अमेरिकी डॉलर था।
• सितंबर 2026 के सेवा व्यापार आंकड़े अनुमानित थे।
• विज्ञप्ति के समय RBI के नवीनतम उपलब्ध सेवा व्यापार आंकड़े अगस्त 2026 तक के थे।
• PIB विज्ञप्ति संख्या 2323944 है।
Background
Foreign trade is an important indicator of India's economic integration with the rest of the world. Exports generate overseas revenue and support domestic production, while imports provide access to energy, raw materials, machinery, intermediate goods and consumer products. India publishes monthly statistics covering merchandise exports and imports along with estimated services trade. On 15 October 2026, the Ministry of Commerce and Industry reported that combined merchandise and services exports during April–September 2026–27 were estimated at US$476.20 billion, representing growth of 13.84% over the corresponding period of the previous year. Merchandise exports increased by 18.51% to US$259.89 billion, while services exports were estimated at US$216.31 billion. Combined imports reached an estimated US$551.13 billion. The resulting combined trade deficit was US$74.93 billion. Strong merchandise export performance included significant increases in electronic goods, petroleum products, chemicals, engineering goods and textile-related categories. The release notes that some figures, especially recent services data, are estimates subject to revision.
पृष्ठभूमि
विदेश व्यापार भारत की विश्व अर्थव्यवस्था के साथ आर्थिक भागीदारी का महत्वपूर्ण संकेतक है। निर्यात विदेशी आय अर्जित करता है और घरेलू उत्पादन को समर्थन देता है, जबकि आयात ऊर्जा, कच्चे माल, मशीनरी, मध्यवर्ती वस्तुओं और उपभोक्ता उत्पादों तक पहुंच उपलब्ध कराता है। भारत वस्तुओं के निर्यात और आयात तथा अनुमानित सेवा व्यापार से संबंधित मासिक आंकड़े प्रकाशित करता है। 15 अक्टूबर 2026 को वाणिज्य एवं उद्योग मंत्रालय ने बताया कि अप्रैल–सितंबर 2026–27 में वस्तुओं और सेवाओं का संयुक्त निर्यात अनुमानतः 476.20 अरब अमेरिकी डॉलर रहा, जो पिछले वर्ष की समान अवधि की तुलना में 13.84 प्रतिशत अधिक था। वस्तु निर्यात 18.51 प्रतिशत बढ़कर 259.89 अरब अमेरिकी डॉलर हुआ, जबकि सेवा निर्यात अनुमानतः 216.31 अरब अमेरिकी डॉलर रहा। संयुक्त आयात अनुमानतः 551.13 अरब अमेरिकी डॉलर तक पहुंचा। इसके परिणामस्वरूप संयुक्त व्यापार घाटा 74.93 अरब अमेरिकी डॉलर रहा। इलेक्ट्रॉनिक वस्तुओं, पेट्रोलियम उत्पादों, रसायनों, इंजीनियरिंग वस्तुओं और वस्त्र संबंधी श्रेणियों में उल्लेखनीय वृद्धि ने वस्तु निर्यात के प्रदर्शन में योगदान दिया। विज्ञप्ति स्पष्ट करती है कि कुछ आंकड़े, विशेषकर हाल के सेवा व्यापार आंकड़े, अनुमानित हैं और उनमें संशोधन हो सकता है।
Why It Matters
This development is important because it shows both the strengths and challenges of India's external trade performance. Strong export growth, especially in electronic goods and engineering products, is relevant to industrial development and India's participation in international supply chains. Services exports also remain important because they generate a substantial surplus that partly offsets the merchandise trade deficit. However, the combined six-month trade deficit widened from US$58.10 billion to US$74.93 billion as imports exceeded exports. Policymakers must therefore consider export competitiveness alongside import demand and external financial stability. For competitive examinations, the release provides important numerical facts and concepts relating to merchandise trade, services trade, trade deficits, export growth and provisional economic statistics.
यह क्यों महत्वपूर्ण है?
यह विकास महत्वपूर्ण है क्योंकि यह भारत के बाह्य व्यापार प्रदर्शन की उपलब्धियों और चुनौतियों दोनों को दर्शाता है। विशेष रूप से इलेक्ट्रॉनिक वस्तुओं और इंजीनियरिंग उत्पादों में मजबूत निर्यात वृद्धि औद्योगिक विकास और अंतरराष्ट्रीय आपूर्ति शृंखलाओं में भारत की भागीदारी से संबंधित है। सेवा निर्यात भी महत्वपूर्ण बना हुआ है क्योंकि इससे प्राप्त पर्याप्त अधिशेष वस्तु व्यापार घाटे की आंशिक भरपाई करता है। हालांकि छह महीनों का संयुक्त व्यापार घाटा 58.10 अरब अमेरिकी डॉलर से बढ़कर 74.93 अरब अमेरिकी डॉलर हो गया क्योंकि आयात निर्यात से अधिक रहा। इसलिए नीति निर्माताओं को निर्यात प्रतिस्पर्धात्मकता के साथ आयात मांग और बाह्य वित्तीय स्थिरता पर भी विचार करना होगा। प्रतियोगी परीक्षाओं के लिए यह विज्ञप्ति वस्तु व्यापार, सेवा व्यापार, व्यापार घाटे, निर्यात वृद्धि और अनंतिम आर्थिक आंकड़ों से संबंधित महत्वपूर्ण संख्यात्मक तथ्य और अवधारणाएं प्रदान करती है।
Exam Connection
Important Examination Facts: Release date: 15 October 2026. Ministry: Ministry of Commerce and Industry. Period: April–September 2026–27. Total exports: US$476.20 billion. Total export growth: 13.84%. Merchandise exports: US$259.89 billion. Merchandise export growth: 18.51%. Estimated services exports: US$216.31 billion. Estimated total imports: US$551.13 billion. Estimated total import growth: 15.68%. Combined trade deficit: US$74.93 billion. Merchandise trade deficit: US$177.64 billion. Estimated services trade surplus: US$102.71 billion. September 2026 total exports: US$80.75 billion. September 2026 total imports: US$94.05 billion. September combined trade deficit: US$13.30 billion. September merchandise exports: US$44.40 billion. September merchandise imports: US$74.61 billion. Electronic goods export growth: 70.44%. Petroleum products export growth: 31.90%. Organic and inorganic chemicals export growth: 24.21%. Engineering goods export growth: 20.91%. Cotton yarn, fabrics, made-ups and handloom export growth: 20.76%. Cumulative non-petroleum exports: US$218.70 billion. Important caution: September services data were estimated because the latest RBI data then available related to August 2026. PIB release number: 2323944.
परीक्षा से संबंध
परीक्षा के महत्वपूर्ण तथ्य: विज्ञप्ति की तिथि: 15 अक्टूबर 2026। मंत्रालय: वाणिज्य एवं उद्योग मंत्रालय। अवधि: अप्रैल–सितंबर 2026–27। कुल निर्यात: 476.20 अरब अमेरिकी डॉलर। कुल निर्यात वृद्धि: 13.84 प्रतिशत। वस्तु निर्यात: 259.89 अरब अमेरिकी डॉलर। वस्तु निर्यात वृद्धि: 18.51 प्रतिशत। अनुमानित सेवा निर्यात: 216.31 अरब अमेरिकी डॉलर। अनुमानित कुल आयात: 551.13 अरब अमेरिकी डॉलर। अनुमानित कुल आयात वृद्धि: 15.68 प्रतिशत। संयुक्त व्यापार घाटा: 74.93 अरब अमेरिकी डॉलर। वस्तु व्यापार घाटा: 177.64 अरब अमेरिकी डॉलर। अनुमानित सेवा व्यापार अधिशेष: 102.71 अरब अमेरिकी डॉलर। सितंबर 2026 का कुल निर्यात: 80.75 अरब अमेरिकी डॉलर। सितंबर 2026 का कुल आयात: 94.05 अरब अमेरिकी डॉलर। सितंबर का संयुक्त व्यापार घाटा: 13.30 अरब अमेरिकी डॉलर। सितंबर में वस्तु निर्यात: 44.40 अरब अमेरिकी डॉलर। सितंबर में वस्तु आयात: 74.61 अरब अमेरिकी डॉलर। इलेक्ट्रॉनिक वस्तुओं के निर्यात में वृद्धि: 70.44 प्रतिशत। पेट्रोलियम उत्पादों के निर्यात में वृद्धि: 31.90 प्रतिशत। कार्बनिक और अकार्बनिक रसायनों के निर्यात में वृद्धि: 24.21 प्रतिशत। इंजीनियरिंग वस्तुओं के निर्यात में वृद्धि: 20.91 प्रतिशत। सूती धागे, कपड़ों, तैयार उत्पादों और हथकरघा निर्यात में वृद्धि: 20.76 प्रतिशत। संचयी गैर-पेट्रोलियम निर्यात: 218.70 अरब अमेरिकी डॉलर। महत्वपूर्ण सावधानी: सितंबर के सेवा व्यापार आंकड़े अनुमानित थे क्योंकि उस समय RBI के नवीनतम उपलब्ध आंकड़े अगस्त 2026 तक के थे। PIB विज्ञप्ति संख्या: 2323944।
 SSC CGL 2026 Ultimate Chapterwise
 SSC CHSL 2026 Ultimate Chapterwise


